
Some of the Things I’ve Learned to Do This Summer
It occurred to me that I’ve mostly been telling you, dear readers, stories from my time here at the City of Charlotte this summer, and not discussing financial and budgetary issues. No longer. I have been building up my anemic Excel skills over the last weeks and months and I thought we might have a little bit of a numbers conversation this week.
Let’s discuss the General Fund. In the first place because I got to set all this stuff up in a sweet spreadsheet and in the second place because the effect of inflation on the value of money is larger than you think.
Here’s the big number, Charlotte’s FY 2011 total General Fund operating budget: $ 445,545,717
This is the number that paves the streets, arrests the bad guys, responds to medical emergencies, and keeps the lights on in the Government Center. It’s the place where most of your property, sales, and other taxes go.
And here’s what that same number was back in FY 2005: $ 347,592,764
That’s a difference of almost $100 million in only six years! A 28% increase! An easily anticipated criticism of the relationship between these two numbers is that the City of Charlotte is increasing spending too rapidly. Given that you’re hanging out with me right now, Mr. proto budget analyst, let’s see if that critique is accurate.
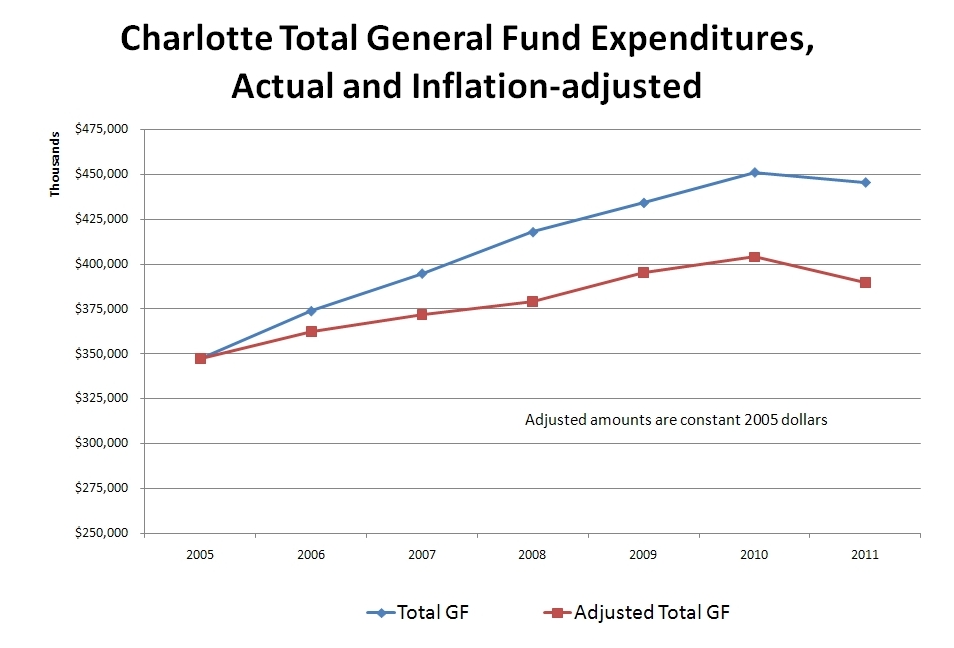
Let’s adjust for inflation and look at those same figures again in constant 2005 dollars.
FY 2005 total General Fund operating budget: $ 347,592,764
FY 2011 total General Fund operating budget: $ 389,897,921
Adjusted for inflation, the increase in expenditures is $42,305,157, a 12% increase. The amount of increase is more than cut in half! This means that of the $100 million increase in actual dollars from 2005 to 2011, only half of it was really increased government spending. The other half was just keeping up with inflation.
Want to see a graph?
I think it’s pretty interesting. But let’s dig a little deeper.
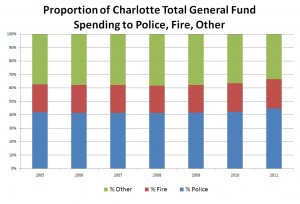
Every year, public safety, which is to say police and fire, make up between 60% to 70% of General Fund expenditures. Here are those relative percentages in a neat stacked column chart.
 I think its fair to say that increases in funding to public safety are rarely called into question. Politically, appropriating money for more police officers and fire fighters, or for more or replacement police and fire equipment, is usually popular. So let’s remove public safety from the amount of spending which critics might find objectionable. Therefore, we’re concerned with the green bars above.
Let’s look at a graph of inflation adjusted General Fund expenditures for non-public safety expenses.
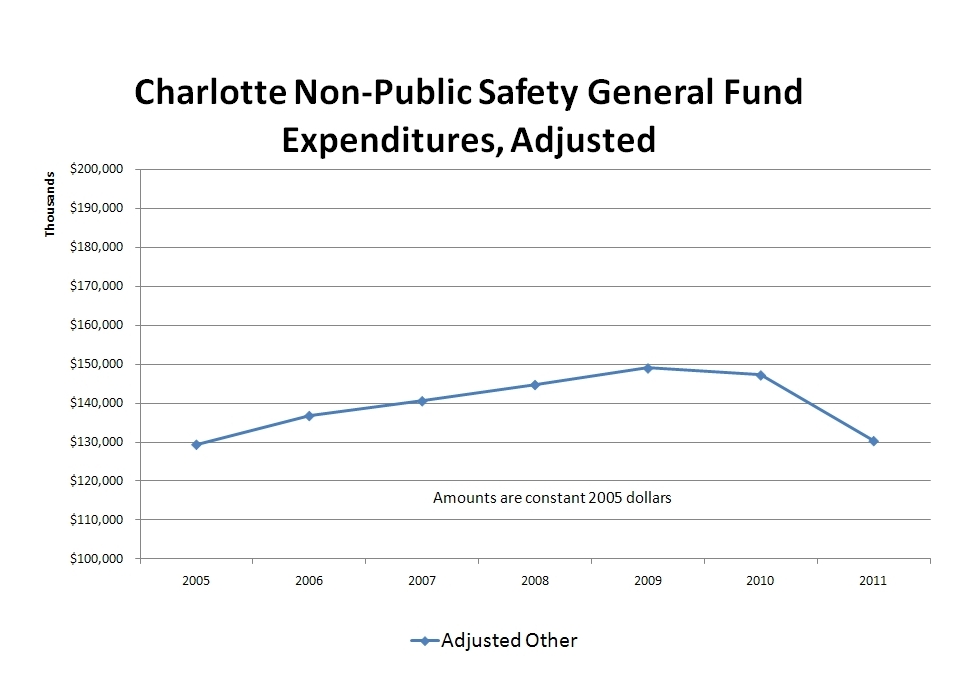 Though there was clearly an increase in spending between 2005 and 2009, over the entire course of our study the total increase was $936,919.
So we can say that since 2005, total General Fund spending for non-public safety purposes has increased about $1 million. This makes up 2.2% of the total $42 million increase in inflation adjusted General Fund expenditures since 2005.
So not only is the percentage increase in spending not really 28% (adjusted for inflation it is 12%) but the proportion of the $42 million causing that increase that is not attributed to public safety is only 2.2%
Put another way, police and fire make up 97.8% of the inflation adjusted $42 million increase in Charlotte’s General Fund spending since 2005.
Clearly this information helps put the two numbers we started with at the top of the post in better context.
And this is only basic analysis. In budgeting, there are so many ways to understand your data, especially where you’re looking at trends over time. You have to consider inflation, the individuals on the council, the existence of grants, amount of debt, annexation, and a multitude of other things when trying to make sense of a budget and trying to determine where the city is going.
Now, for you finance and economics people, I realize this is small potatoes. But I’m coming from a background in English and it is honestly thrilling that I am able to visualize and manipulate numbers like this. Thank you Carolina MPA and Charlotte Budget and Evaluation.

3 Responses to “Some of the Things I’ve Learned to Do This Summer”
Molly Boyle
Good work, Gus. Bill will be so proud!
August Caravalho
Thanks! Just making graphs, like I do.
Remains of the Day: Only Smartphones Can Get Sprint’s Unlimited Data Plans [For What It's Worth] | Romantic Getaways
[…] latin pj harvey sons of anarchy season 3 hydrangeas charlie hunnam charlie hunnam life quotes This article is copyright © 2011 of Romantic Getaways […]